Chapter 3 Pivot Table Fields and Values
Pivot table fields and values are fundamental components that define the structure and analysis of pivot tables. In this section, we delve into the details of row fields, column fields, value fields, and report filters. We explore how each of these elements contributes to the organization, summarization, and manipulation of data within pivot tables. By understanding the capabilities and options available for pivot table fields and values, readers will gain a solid foundation to leverage the full potential of pivot tables in their data analysis endeavors.
3.1 Row Fields
3.1.1 What are Row Fields?
Row fields determine the arrangement of data in the rows of a pivot table. Each unique value in a row field creates a separate row in the pivot table, facilitating data grouping and segmentation. We explore the concept of row fields in detail, including how to add, remove, and rearrange them, as well as techniques for expanding and collapsing data at different levels of detail.
3.1.2 Adding Row Fields
To add a row field to a pivot table in Excel, you can simply drag and drop a column header from the PivotTable Field List into the “Rows” section of the PivotTable Fields pane. Alternatively, you can check the box next to the desired field name in the PivotTable Field List to include it as a row field.
3.1.3 Organizing Data with Row Fields
Row fields provide a way to organize and structure data in a pivot table. They allow you to group data by various categories or dimensions, providing a hierarchical structure for analysis. For example, in a sales dataset, you might have row fields such as “Region,” “Product Category,” and “Sales Representative.” This arrangement allows you to examine sales performance by region, product category, and individual sales representatives.
3.1.4 Expanding and Collapsing Row Fields
One of the key features of row fields is the ability to expand and collapse the levels of detail in a pivot table. By clicking the small plus or minus icons next to a row field, you can expand or collapse the data at different levels of detail. This functionality is useful when dealing with large datasets, as it allows you to focus on specific subsets of data or obtain a more comprehensive view of the information.
3.1.5 Sorting and Filtering Row Fields
Excel provides options to sort and filter data within row fields. By right-clicking on a row label or using the Sort and Filter options in the ribbon, you can rearrange the order of rows based on specific criteria or apply filters to display only relevant data. Sorting and filtering row fields help in identifying trends, outliers, or specific data subsets that require further analysis.
3.1.6 Customizing Row Field Settings
Excel offers various customization options for row fields in pivot tables. You can adjust the field settings to control how data is displayed within the rows. For instance, you can choose to show or hide subtotals, modify the number format, change the layout, and customize the appearance of the row labels. These settings allow you to present data in a format that best suits your analytical needs.
3.1.7 Summary Totals in Row Fields
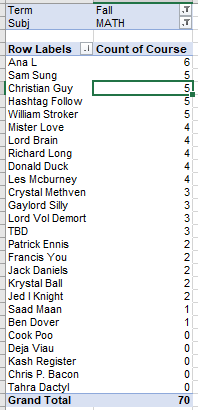
Row fields provide an automatic summary of values within each row, based on the selected value fields. Excel offers various aggregation functions, such as sum, count, average, min, max, etc., that calculate the summary totals for the data. This feature allows you to quickly analyze and compare data across different row categories.
3.1.8 Nested Row Fields
In more complex datasets, you may need to create nested row fields, where one field is nested within another. This allows for a more detailed analysis and breakdown of data. For example, you can have a row field for “Year” and nest another row field for “Quarter” within it. This arrangement provides a hierarchical view of data, enabling you to explore trends and patterns at different levels of granularity.
3.1.9 Drill-Down Analysis
Row fields support drill-down analysis, allowing you to explore the underlying data within a specific row. By double-clicking on a row value, you can drill down into the data and view the individual records that contribute to that particular row. This feature is valuable when you want to investigate anomalies, identify contributing factors, or perform a more granular analysis of the data.
3.2 Column Fields
3.2.1 What are Column Fields?
Column fields determine the arrangement of data in the columns of a pivot table. Similar to row fields, each unique value in a column field creates a separate column in the pivot table, enabling data analysis from different perspectives. We discuss the usage of column fields, including techniques for adding, removing, and rearranging them to generate desired columnar representations of data.
3.2.2 Adding Column Fields
To add a column field to a pivot table, you can simply drag and drop a column header from the PivotTable Field List into the “Columns” section of the PivotTable Fields pane. Alternatively, you can check the box next to the desired field name in the PivotTable Field List to include it as a column field.
3.2.3 Analyzing Data with Column Fields
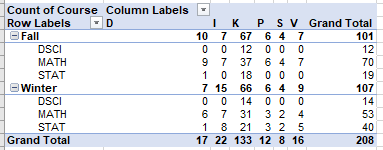
Column fields allow for a more in-depth analysis of data in pivot tables. By incorporating column fields, you can segment and compare data across different categories or dimensions. For instance, in a sales dataset, you might have column fields such as “Product Category,” “Month,” or “Region.” This arrangement facilitates the examination of sales performance by product category, month, or region, enabling you to identify patterns and trends.
3.2.4 Expanding and Collapsing Column Fields
Similar to row fields, column fields offer the flexibility to expand or collapse levels of detail within a pivot table. By clicking the plus or minus icons next to a column field, you can expand or collapse the data at different levels, adjusting the level of granularity in the analysis. This feature is particularly useful when dealing with large datasets or when you want to focus on specific subsets of data.
3.2.5 Sorting and Filtering Column Fields
Excel provides options to sort and filter data within column fields. By right-clicking on a column label or using the Sort and Filter options in the ribbon, you can rearrange the order of columns based on specific criteria or apply filters to display only relevant data. Sorting and filtering column fields enable you to examine data in a customized manner and highlight specific trends or outliers.
3.2.6 Customizing Column Field Settings
Excel offers various customization options for column fields in pivot tables. You can modify the field settings to control how data is displayed within the columns. For instance, you can choose to show or hide subtotals, adjust the number format, change the layout, and customize the appearance of the column labels. These settings allow you to present data in a format that best suits your analytical needs and enhances data visualization.
3.2.7 Grouping Data with Column Fields
Column fields can be utilized to group data into meaningful categories, simplifying the analysis and presentation of complex datasets. Excel provides the option to group dates, numbers, or text values within column fields. For example, you can group sales data by quarters or group product prices into price ranges. Grouping data enhances the clarity and organization of the pivot table, enabling easier interpretation and comparison of data.
3.2.8 Calculations within Column Fields
Excel pivot tables offer the ability to perform calculations within column fields. You can add calculated fields that derive new values based on existing data. This feature allows you to apply mathematical operations, perform comparisons, or create custom calculations to obtain additional insights. Calculated fields within column fields provide a flexible way to incorporate calculated data elements in your analysis.
3.2.9 Advanced Column Field Techniques
Excel provides advanced techniques for column fields, including the use of slicers and timelines. Slicers enable interactive filtering by providing visual buttons that represent different values within a column field. Timelines, specifically useful for date-based data, provide an intuitive interface for filtering and analyzing time-based data in columns. These features enhance the interactivity and flexibility of column fields, making data exploration and analysis more dynamic.
3.3 Value Fields
3.3.1 Understanding Value Fields
Value fields in Excel pivot tables contain the data that is summarized and displayed within the pivot table. These fields typically consist of numeric or measurable data, such as sales figures, quantities, or percentages. Value fields serve as the foundation for calculations and aggregations, providing a comprehensive overview of the data.
3.3.2 Adding Value Fields
To add a value field to a pivot table, you can drag and drop a column header from the PivotTable Field List into the “Values” section of the PivotTable Fields pane. Alternatively, you can check the box next to the desired field name in the PivotTable Field List to include it as a value field.
3.3.3 Aggregating Data with Value Fields
Value fields allow for the aggregation and summarization of data within pivot tables. Excel provides various aggregation functions, including sum, count, average, min, max, and more. These functions calculate the summary values based on the data in the value field. For example, you can sum the sales figures, count the number of transactions, or calculate the average price.
3.3.4 Customizing Value Field Settings
Excel offers customization options for value fields, allowing you to control how the data is summarized and displayed in the pivot table. You can adjust settings such as number format, decimal places, and display options for subtotals and grand totals. These settings enable you to present the data in a format that best suits your analysis and reporting requirements.
3.3.5 Value Field Summarization
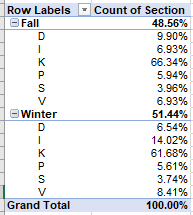
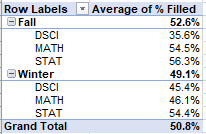
Excel provides flexibility in summarizing value fields within pivot tables. You can choose to display the summarization as sums, averages, counts, percentages, or other applicable calculations. Depending on the nature of your data and analysis objectives, you can select the appropriate summarization function to obtain the desired insights.
3.3.6 Multiple Value Fields
Pivot tables allow you to include multiple value fields, enabling you to analyze and compare multiple aspects of the data simultaneously. For instance, you can include sales figures and profit margins as separate value fields to gain a comprehensive understanding of the financial performance. The ability to incorporate multiple value fields enhances the depth and breadth of analysis within pivot tables.
3.3.7 Calculated Fields with Value Fields
Excel pivot tables offer the option to create calculated fields based on the existing value fields. Calculated fields allow you to perform additional calculations and derive new insights from the data. You can create formulas using operators, functions, and references to other value fields within the pivot table. Calculated fields provide a flexible way to incorporate custom calculations and perform complex analysis.
3.3.8 Formatting and Conditional Formatting
Excel provides formatting options to enhance the visual presentation of value fields within pivot tables. You can apply number formatting, such as currency, percentage, or scientific notation, to improve readability. Additionally, conditional formatting allows you to highlight specific data patterns, trends, or outliers based on predefined rules or custom conditions. These formatting options aid in data visualization and emphasize key insights.
3.3.9 Filtering and Sorting Value Fields
Value fields can be filtered and sorted within pivot tables to focus on specific subsets of data or identify trends. Excel provides filtering options that allow you to display or hide specific values, apply top/bottom filters, or use custom filters to select data based on specific criteria. Sorting value fields in ascending or descending order helps identify the highest or lowest values, enabling you to analyze the data more effectively.
3.3.10 Drill-Down Analysis with Value Fields
Value fields support drill-down analysis within pivot tables. By double-clicking on a value in the pivot table, you can access the underlying data that contributes to that value. This feature is useful when you want to investigate the details of specific aggregated values, such as exploring the individual transactions that make up a total sales figure. Drill-down analysis allows for a more granular examination of the data and facilitates data exploration.
3.4 Report Filters
Report filters provide a means to filter the data displayed in a pivot table based on specific criteria. By applying report filters, users can focus on subsets of data that are relevant to their analysis, enabling more targeted and specific insights. We discuss the concept of report filters, including how to add, remove, and customize them, as well as techniques for applying multiple filters and utilizing advanced filtering options.
3.4.1 Adding Report Filters
To add a report filter to a pivot table, you can drag and drop a column header from the PivotTable Field List into the “Report Filters” section of the PivotTable Fields pane. Alternatively, you can check the box next to the desired field name in the PivotTable Field List to include it as a report filter.
3.4.2 Applying Report Filters
Once a report filter is added to a pivot table, you can use it to filter the data displayed in the pivot table. Excel provides various options for applying report filters. You can select or deselect specific values in the filter drop-down menu to include or exclude them from the analysis. Additionally, you can apply multiple report filters to further refine the data.
3.4.3 Filtering Numeric and Date Fields
Report filters offer specialized filtering options for numeric and date fields. For numeric fields, Excel provides filtering options such as equal to, not equal to, greater than, less than, and between. This allows you to narrow down the data based on specific numeric criteria. Similarly, for date fields, you can apply filters based on a specific date, date range, or other conditions.
3.4.4 Customizing Report Filter Settings
Excel offers customization options for report filters to enhance their functionality and appearance. You can modify the filter settings to control how the data is displayed and filtered. For example, you can show or hide items with no data, display items in alphabetical or custom order, or sort items based on specific criteria. These settings enable you to customize the report filter behavior according to your analysis requirements.
3.4.5 Slicers for Enhanced Filtering
Slicers are an alternative way to apply report filters in pivot tables. They provide a visual and user-friendly interface for filtering data. Slicers are interactive buttons or menus that represent different values within a report filter. By selecting or deselecting slicer buttons, you can dynamically filter the data displayed in the pivot table. Slicers enhance the visual experience and make filtering more intuitive.
3.4.6 Using Timelines for Date Filtering
Timelines are a specialized type of slicer designed specifically for date fields. They provide an intuitive and interactive way to filter and analyze time-based data within a pivot table. Timelines enable you to easily select specific time periods, such as months, quarters, or years, and visualize the filtered data. Timelines enhance the analysis of time series data and make it easier to identify trends and patterns.
3.4.7 Grouping and Hierarchical Filtering
Excel pivot tables allow you to group and hierarchically filter data based on report filters. You can group data within report filters to create logical categories or groupings. For example, you can group products by categories or group regions by territories. This grouping functionality enables a more organized and structured analysis, particularly for large datasets with numerous values.
3.4.8 Dynamic Filtering and Interactive Analysis
Report filters provide dynamic filtering capabilities within pivot tables. You can modify report filter selections on the fly to instantly update the data displayed in the pivot table. This interactivity allows for real-time exploration and analysis of the data. By adjusting the report filter criteria, you can dynamically observe the impact on the summarized data, enabling quick and interactive data analysis.
3.4.9 Filtering Best Practices
To maximize the effectiveness of report filters, it is important to follow best practices. These include keeping your data updated, refreshing pivot tables when necessary, using clear and descriptive field names, and utilizing efficient filtering techniques to focus on relevant data subsets. By adhering to these practices, you can ensure accurate and meaningful analysis using report filters.